
The ANALYZE command is PostgreSQL’s built-in engine for statistical discovery. In this article, I will walk you through the architectural mechanics of ANALYZE, how PostgreSQL builds distribution histograms, how to configure Autovacuum for optimal statistics collection, and the advanced tuning strategies required for high-throughput enterprise databases.
PostgreSQL ANALYZE
What Is PostgreSQL ANALYZE and Why Does It Matter?
In PostgreSQL, executing a query is a multi-phase lifecycle: parsing, rewriting, planning, and execution. The Cost-Based Optimizer (CBO) sits at the heart of this process. It evaluates dozens or hundreds of possible execution paths—Index Scans, Bitmap Index Scans, Sequential Scans, Hash Joins, and Merge Joins—and selects the path with the lowest estimated computational cost.
To estimate these costs accurately, the planner must answer critical questions before reading your table data:
- How many total rows are in this table?
- How many distinct values exist in this column?
- What fraction of the table contains
NULLvalues? - What are the most common values, and how frequently do they appear?
- How are data values distributed across physical disk pages?
ANALYZE is the command that answers these questions. When executed, it collects statistical profiles of table contents and stores the results in the pg_statistic system catalog (and exposes them via the user-friendly pg_stats view).
ANALYZE vs. EXPLAIN ANALYZE
One of the most frequent points of confusion among developers is the distinction between ANALYZE and EXPLAIN ANALYZE. While they share a keyword, their roles are completely different:
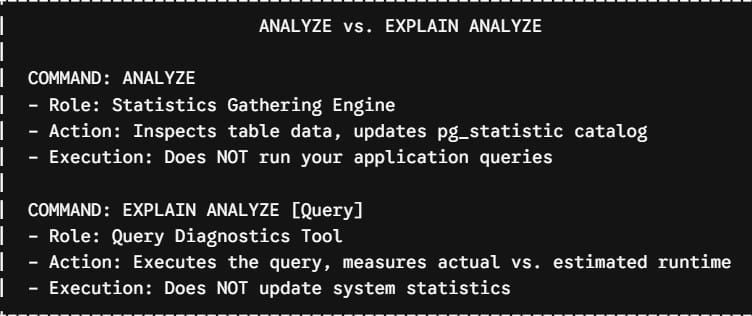
Under the Hood: How ANALYZE Collects Statistics
Running a full sequential scan across a multi-terabyte table just to gather statistics would crush production I/O. To avoid this, PostgreSQL uses a mathematically rigorous statistical sampling method based on the Vitter reservoir sampling algorithm.
1. Reservoir Sampling Mechanics
Instead of scanning every single page, ANALYZE reads a random sample of table blocks. By default, PostgreSQL targets an unbiased sample size determined by the default_statistics_target parameter.
$$\text{Target Sample Rows} = 300 \times \text{statistics\_target}$$
With the default default_statistics_target = 100, PostgreSQL samples approximately 30,000 randomly selected rows across the table. This provides a statistically sound profile of data distribution with minimal disk I/O and runtime overhead.
2. The Statistical Catalog: Decoding pg_stats
Once sampling finishes, PostgreSQL writes the metrics to pg_statistic. Because pg_statistic is restricted to superusers for security reasons, DBAs read the pg_stats view.
| Column in pg_stats | Architectural Purpose | Optimization Role |
null_frac | Percentage of entries that are NULL | Helps planner decide whether to use partial indexes |
avg_width | Average storage width of the column in bytes | Used to calculate memory allocation for sort/hash operations |
n_distinct | Estimated number of distinct values (<0 indicates ratio) | Determines selectivity for grouping and equality operations |
most_common_vals (MCV) | Array of the most frequently occurring values | Optimizes equality filters (WHERE status = 'ACTIVE') |
most_common_freqs (MCF) | Array of frequencies for the MCV list | Supplies exact probabilities for high-frequency values |
histogram_bounds | Equi-depth histogram bucket boundaries | Estimates selectivity for range queries (<, >, BETWEEN) |
correlation | Statistical correlation between physical disk order and logical value order | Determines whether an Index Scan or Bitmap Scan is cheaper |
Core Syntax and Execution Options
PostgreSQL provides flexible command structures to analyze entire databases, specific tables, or individual columns.
Basic Syntax Forms
- Analyze the Entire Database: Scans all tables in the current database where the current user has read permissions.
- Analyze a Specific Table: Focuses statistical sampling on a single table and its physical partitions.
- Analyze Specific Columns: Restricts the operation to targeted columns, minimizing runtime on wide tables.
- Verbose Mode: Outputs real-time progress details, including sampled row counts and computed distinct values.
Fine-Tuning Statistics Targets for Complex Data
The default statistics target of 100 is balanced for general web applications, but modern analytics and high-cardinality enterprise workloads often demand finer granularity.
Adjusting Global vs. Column-Level Targets
Increasing the statistics target expands the size of the Most Common Values (MCV) array and the number of histogram buckets (up to a maximum of 10,000).
- Global Configuration: Modifying
default_statistics_targetinpostgresql.confscales sampling across the entire cluster. - Granular Column Configuration: Altering the statistics target on individual high-cardinality or skewed columns avoids inflating sampling overhead across the entire database.
When to Increase Column Targets
- High-Cardinality Search Fields: UUIDs, natural transaction identifiers, and external system keys.
- Non-Uniform Distributions: Columns where 1% of the keys account for 90% of query volume.
- Skewed Continuous Ranges: Financial transaction amounts, microsecond timestamps, and telemetry sensor readings.
Extended Statistics: Handling Multi-Column Correlations
Standard ANALYZE evaluates each column in total isolation. In relational modeling, however, real-world data columns are frequently correlated. When columns share statistical dependencies, the query planner multiplies individual selectivities together, leading to severe under-estimations of row counts.
The Three Types of Extended Statistics
PostgreSQL allows you to define multivariate statistics objects to eliminate planning errors caused by correlated data:
- Functional Dependencies (
dependencies): Informs the planner when the value of one column strictly determines or heavily influences another (e.g.,StatedeterminesCountry, orZip CodedeterminesCity). - Distinct Values (
ndistinct): Calculates multi-column cardinality for combinedGROUP BYclauses, preventing the optimizer from underestimating memory requirements for hash aggregation. - Multivariate Most Common Values (
mcv): Generates unified, multi-column frequency lists for queries that filter across multiple correlated columns simultaneously.
Once an extended statistics object is created, running ANALYZE on the target table populates the multivariate distributions automatically.
Automated Statistics: Mastering Autovacuum and Autoanalyze
In modern production environments, you should rarely need to trigger manual ANALYZE commands during standard operational workloads. PostgreSQL delegates this responsibility to the Autovacuum daemon.
The Autoanalyze Threshold Formula
The daemon monitors write activity using the PostgreSQL statistics collector. A table becomes eligible for automatic analysis when the number of inserted, updated, or deleted tuples exceeds a calculated threshold:
$$\text{Autoanalyze Threshold} = \text{autovacuum\_analyze\_threshold} + (\text{autovacuum\_analyze\_scale\_factor} \times \text{Total Live Tuples})$$
Core Autovacuum Settings
| Configuration Parameter | Default Value | Production Recommendation |
autovacuum | on | Always maintain on |
autovacuum_analyze_threshold | 50 rows | 50 rows |
autovacuum_analyze_scale_factor | 0.10 (10%) | 0.02 to 0.05 (2% to 5% for large tables) |
autovacuum_max_workers | 3 | 4 to 8 (scaled to available CPU cores) |
autovacuum_naptime | 1 min | 15s to 30s for high-write systems |
Overcoming the Large-Table Scale Factor Trap
On a table containing 100 million rows, a default autovacuum_analyze_scale_factor of 0.10 means that 10 million rows must change before an automated analysis triggers. In high-velocity transactional databases, statistical drift can degrade execution plans long before that threshold is reached.
To prevent this issue, tune the scale factor directly at the table level for massive tables rather than adjusting the global cluster configuration.
Summary of Core Principles
Maintaining optimal query performance in PostgreSQL comes down to three operational disciplines:
- Understand the Planner’s Dependency: The optimizer makes plan choices based entirely on the probability distributions recorded in
pg_statistic. Accurate statistics prevent catastrophic plan choices. - Tune Autovacuum for Scale: Do not rely on default global scale factors for multi-million-row tables. Override thresholds at the table level to keep statistics fresh.
- Capture Correlations: When queries filter across logically linked columns, standard 1D histograms fail. Use PostgreSQL’s Extended Statistics to give the planner the full picture.
You may also like the following articles:

Rajkishore Sahoo is a Microsoft Azure consultant with more than 14 years of hands-on experience building cloud-native data solutions across Azure and AWS, focused on Azure SQL Database, Azure SQL Managed Instance, and the pipelines that connect them to production apps. Day to day, he provisions Azure SQL instances, configures firewalls and connection strings, tunes queries for cloud workloads, and wires databases into Azure Functions and Logic Apps. Read more